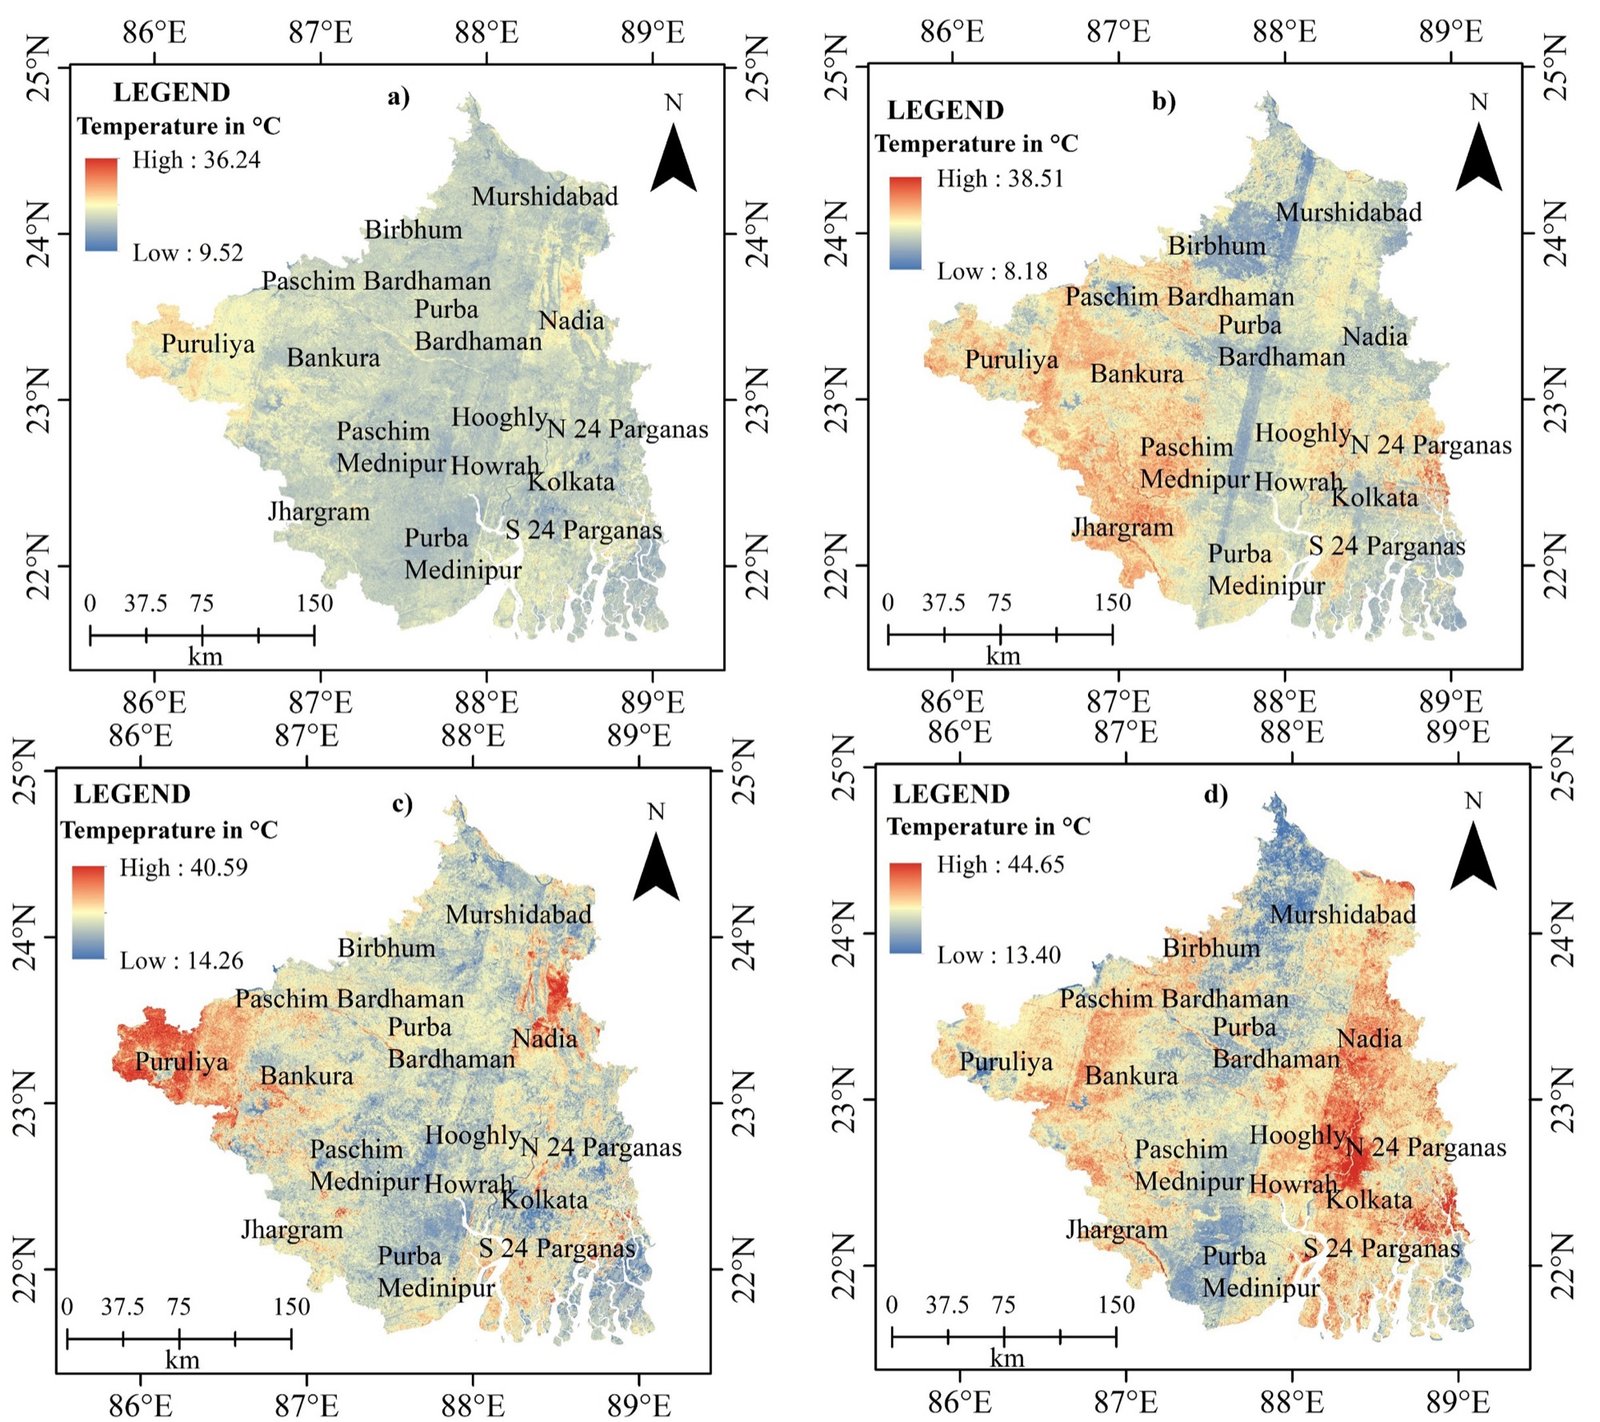
01 / 13NDVI · southern West Bengal, four dates
Learning · Worked maps
Maps from real remote sensing and GIS studies in West Bengal — land cover change, vegetation and heat, soil erosion and terrain — each with a note on what it shows and how to read it.
Each section below takes one family of analyses and shows finished maps from studies in West Bengal. Select a map to see it, read the note beside it, and open it at full size to study the legend, scale and grid.
When you read any thematic map, ask four questions: what is mapped (the variable and its unit), when (the date or the dates compared), how it was derived (classification, an index, a model) and what the pattern means on the ground.
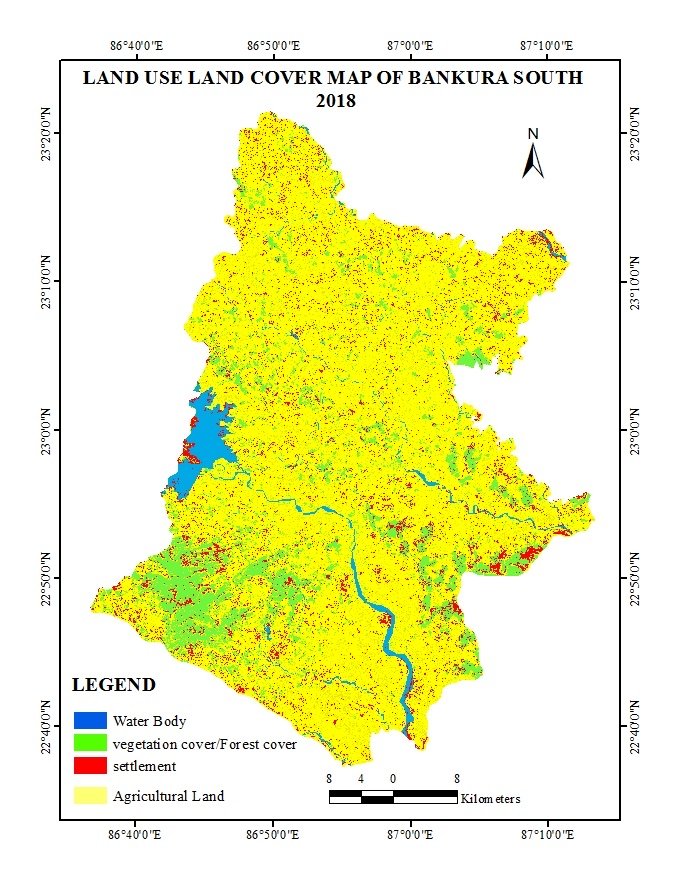
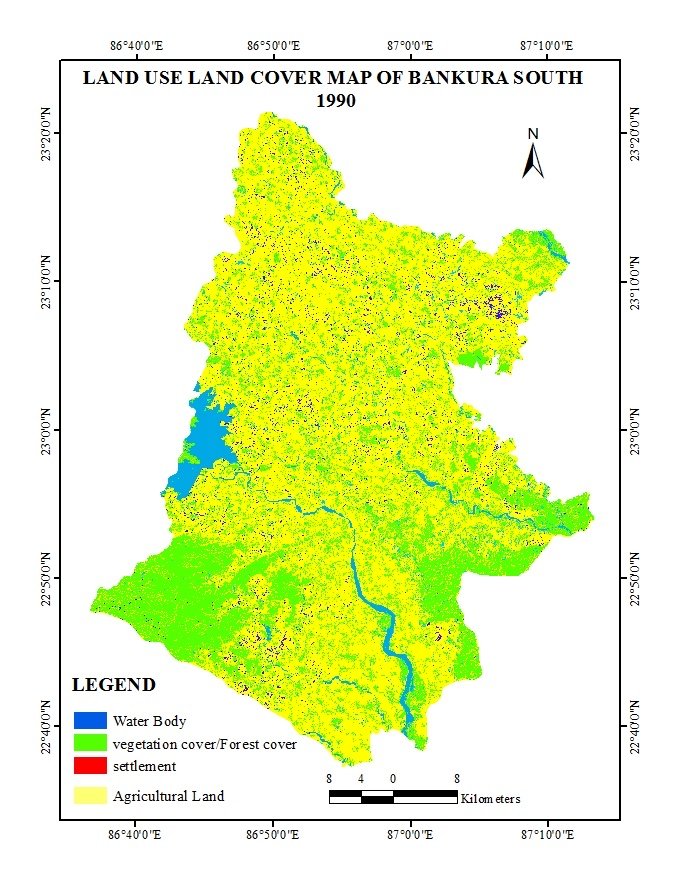
Satellite images classified into land-use and land-cover (LULC) classes, compared across dates to measure change.
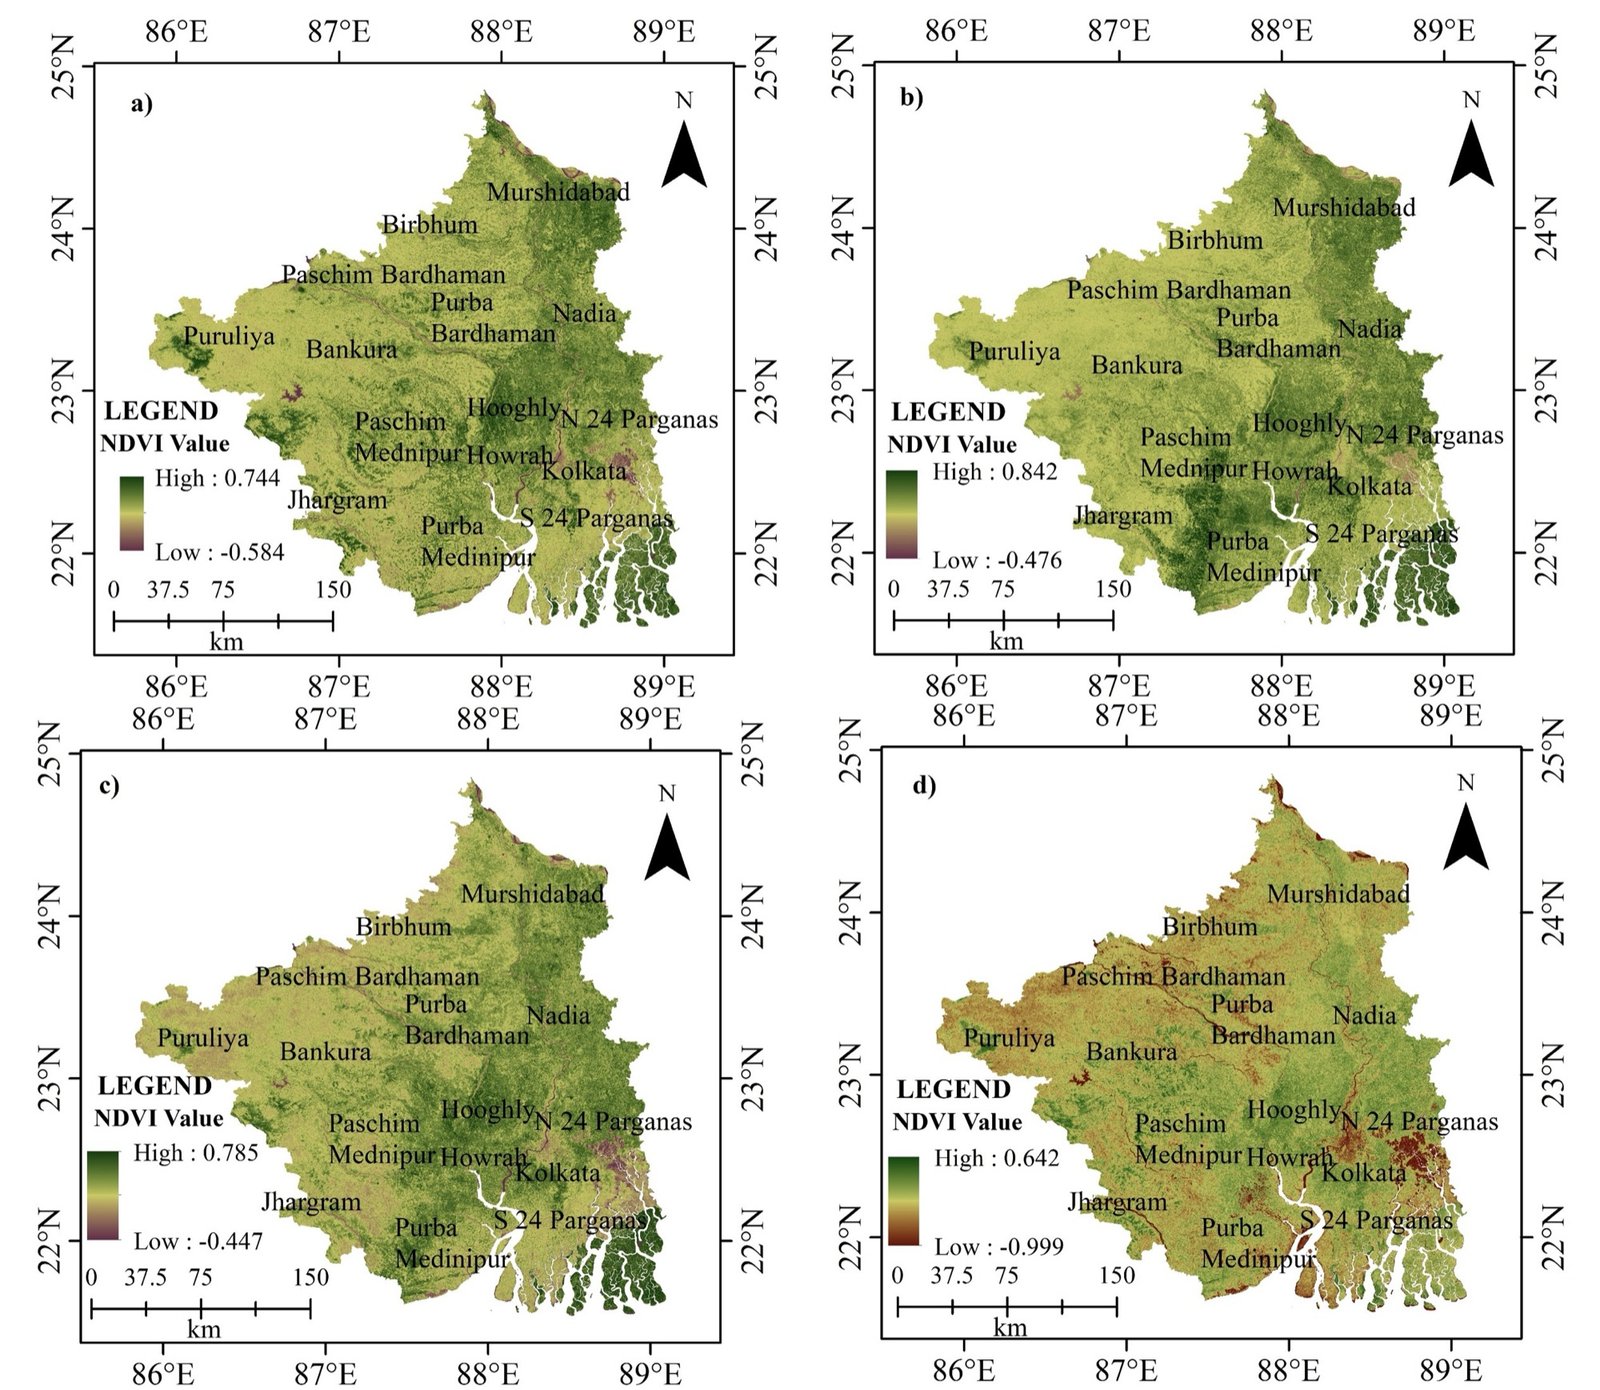
Spectral indices and thermal bands turn imagery into measurements of vegetation health and land surface temperature.
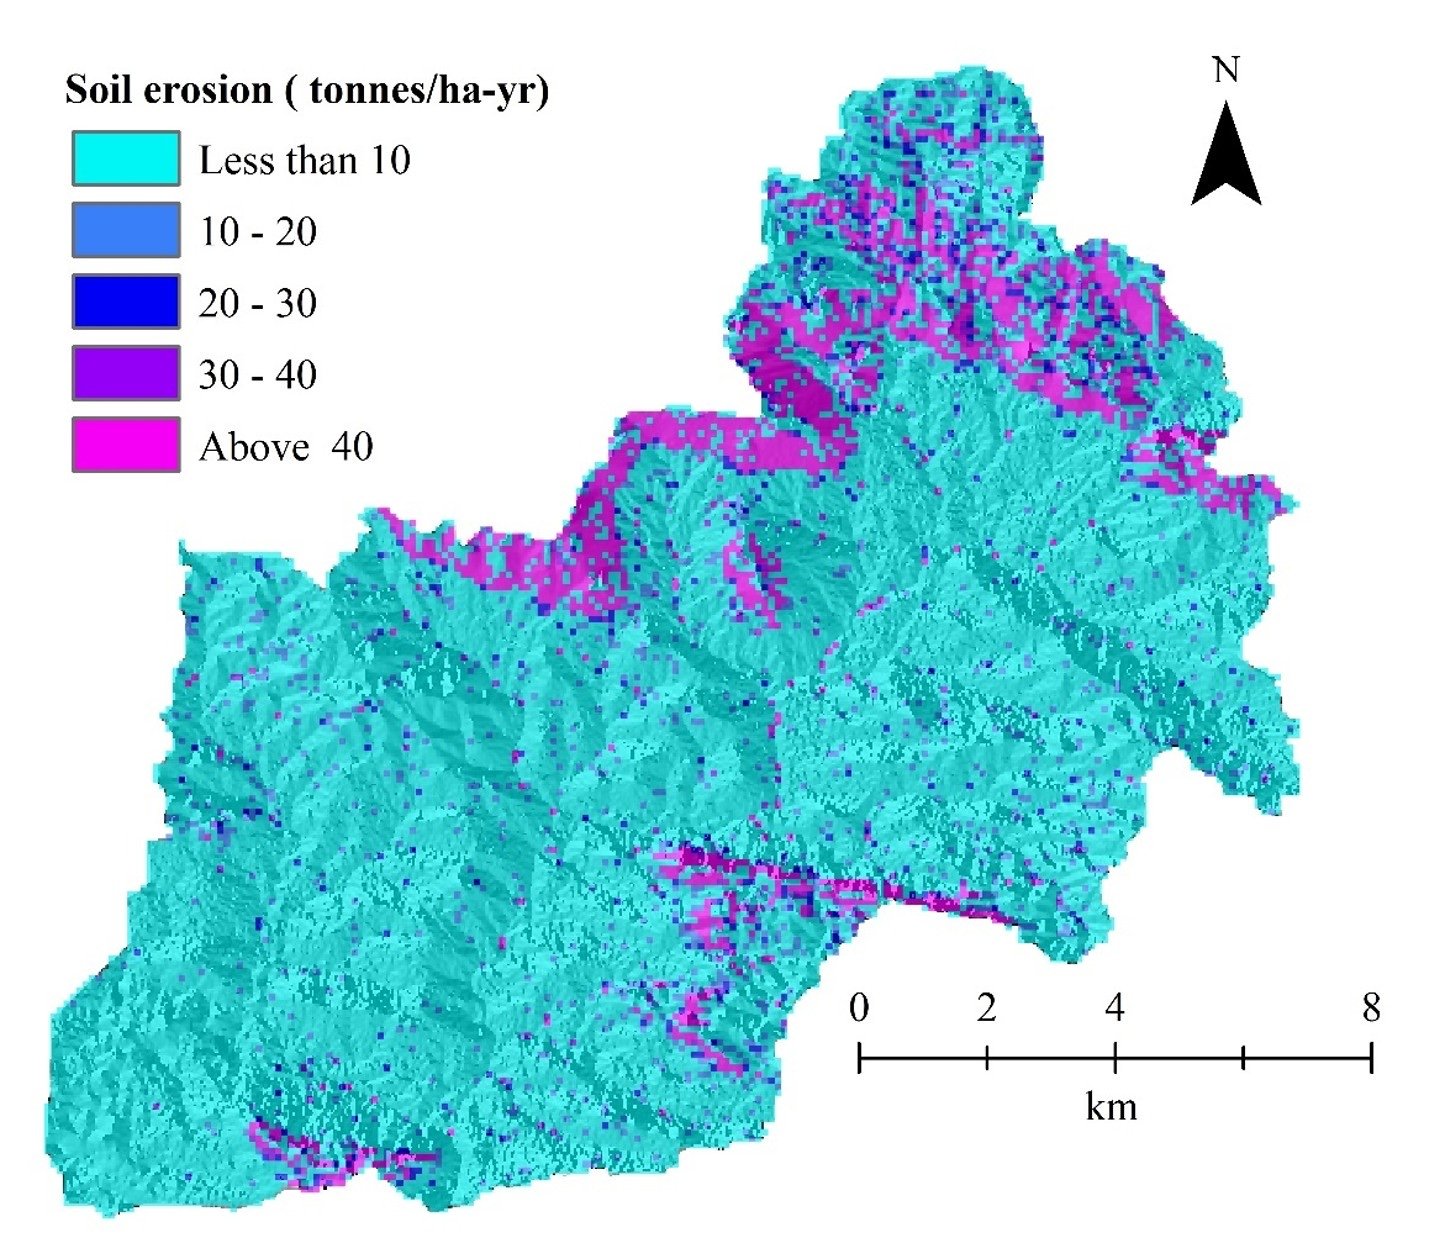
Erosion models and watershed indices estimate how much soil is lost, how much of it reaches the river, and which sub-watersheds to treat first.
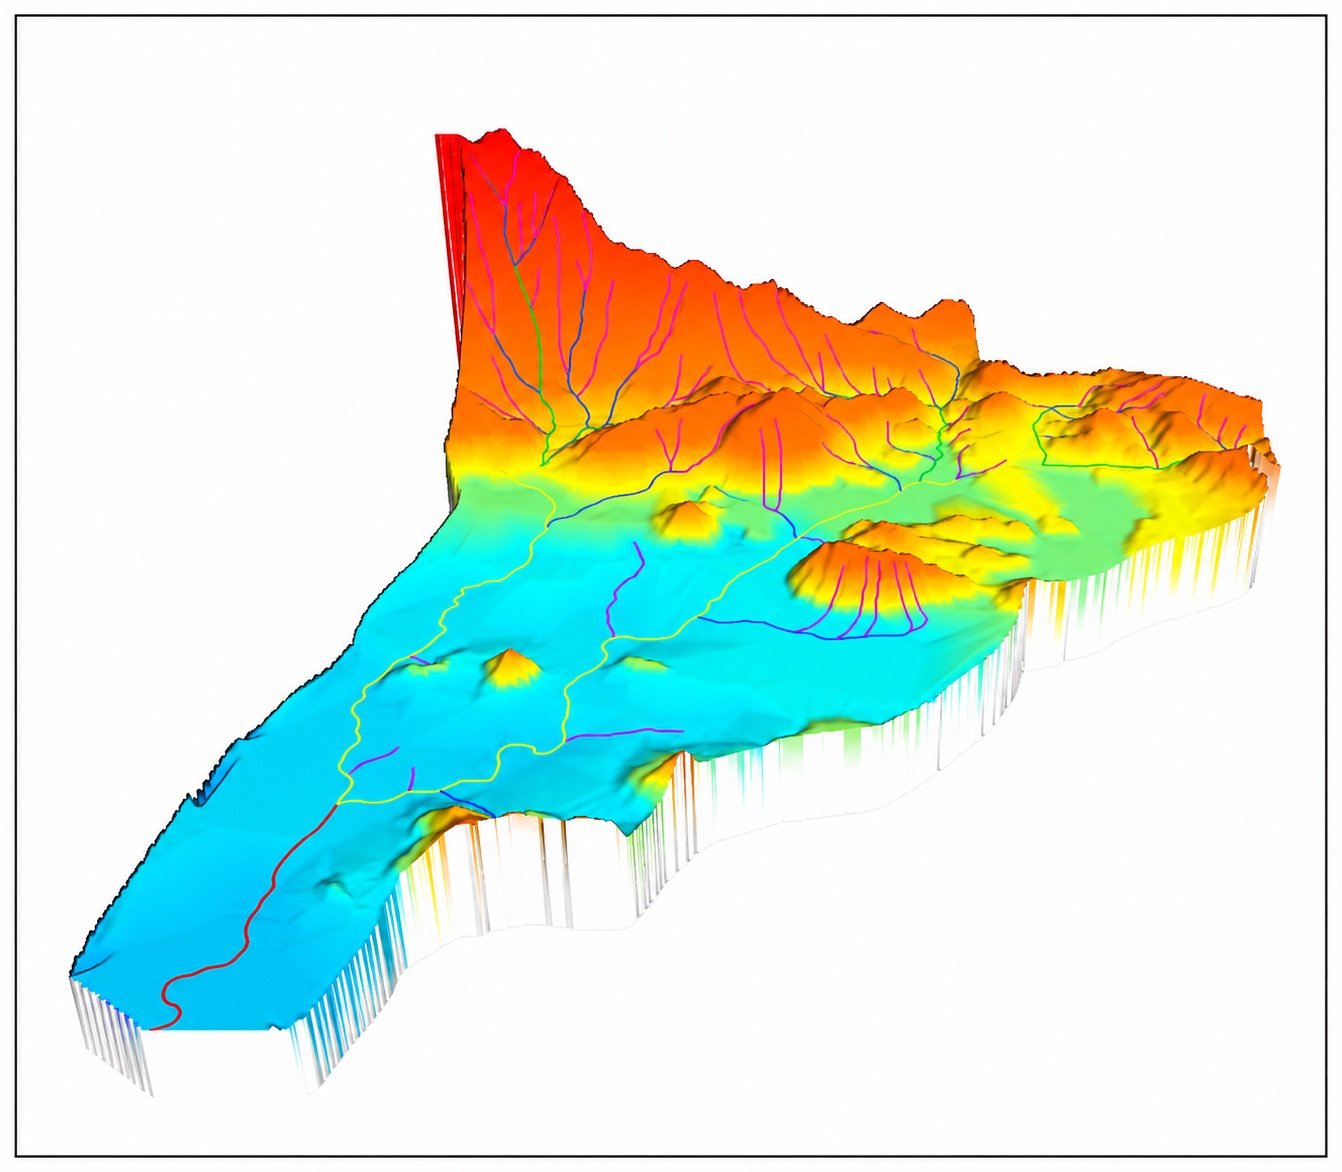
A digital elevation model (DEM), exaggerated vertically and draped with other layers, makes relief and drainage easy to grasp.
Our workshops and internships teach classification, spectral indices, LST retrieval, erosion modelling and 3D terrain analysis with your own study area.